

1:简介
在我看来,Pandas是一款数据处理工具,它相比于numpy而言,更加具有针对性。比如说,Pandas提供了两种数据结构,Series和DataFrame,分别表示一维数据和二维数据,而numpy则还有更多维数据。Pandas的特色是,它可以使用自定义的索引来表示数据的特点,这和Excel表格很类似。而numpy只有固定的整数索引。
在数据中,我们可能会有这种情况,一个二维表格,每一行,表示不同的学生,每一列表示学生的不同信息。如下表所示,
| 年龄 | 班级 | |
|---|---|---|
| 小明 | 19 | 4班 |
| 小张 | 15 | 2班 |
| 小华 | 17 | 1班 |
由年龄和班级构成的二维数组,在numpy中是无法建立的,因为numpy无法建立班级的字符串格式数据,且数组内不能含有多种属性的数据,比如年龄的数据格式是int,而班级则是string。
此时Pandas的作用就出来了。Pandas可以指定上述数据每一行的意义为名字,所以其行索引Index可以设置为[‘小明’,’小张’,’小华’],而其纵坐标的索引columns设置为[‘年龄’,’班级’]。然后再向这个DataFrame中添加数据即可。
2:入门
2.1 生成对象
引入Pandas:
1 | import numpy as np |
生成Series:
1 | s = pd.Series([1,4,1,np.nan,8]) |
生成DataFrame:
1 | dates = pd.date_range('20130101',periods=6) |
date_range函数可以生成一个时间序列,参数有,开始时间,结束时间,序列个数,间隔单位等。
df为:
1 | A B C D |
使用字典对象生成DataFrame:
1 | df2 = pd.DataFrame({'A':1, |
2.2 查看数据
查看DataFrame头部和尾部数据:
1 | df.head() |
显示索引和列名:
1 | df.index |
df.to_numpy()将DataFrame数据转为numpy数据
df.describe()查看数据统计摘要
df.T转置
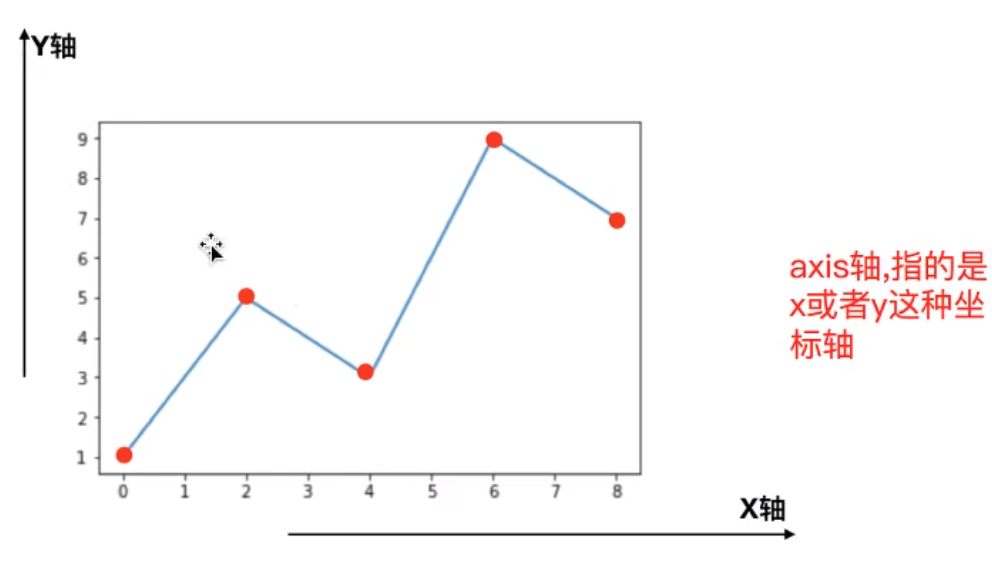
df.sort_index(axis=1,ascending=False)按轴上升排序
df.sort_values(by='B')按轴排序
2.3 选择数据
产生Series
1 | df['A'] |
切片:
1 | df[0:3] |
1 | df['20130102':'20130104'] |
按标签选择:
1 | df.loc[dates[0]] |
用标签选多列:
1 | df.loc[:,['A','B']] |
用标签切片:
1 | df.loc['20130102':'20130104',['A','B']] |
提取标量:
1 | df.loc[dates[0],'A'] |
按位置选:
1 | df.iloc[3] |
用整数切片:
1 | df.iloc[3:5,0:2] |
用整数列表按位置切片:
1 | df.iloc[[1,2,4],[0,2]] |
按位置访问标量:
1 | df.iloc[1,1] |
布尔索引:
用单列的值:
1 | df[df.A>0] |
1 | Out[39]: |
选择满足条件的值:
1 | df[df>0] |
1 | Out[40]: |
isin()筛选
1 | df2 = df.copy() |
2.4 缺失值Nan
reindex重建索引,不会修改源数据
1 | df1 = df.reindex(index = dates[0:4],columns=list(df.columns)+['E']) |
1 | Out[57]: |
删除含缺失值的行:
1 | df1.dropna(how='any') |
填充缺失值:
1 | df1.fillna(value=5) |
提取缺失值的布尔掩码:
1 | pd.isna(df1) |
2.5 运算
一般,运算时会排除缺失值
在列上计算平均值:
1 | df.mean() |
在行上计算:
1 | df.mean(1) |
1 | Out[62]: |
减法:
1 | s = pd.Series([1,3,5,np.nan,6,8], index=dates).shift(2) |
s与df的index轴是相同的,或者说在行上他们数据的个数相同,所以,sub第二个参数填写index或者0,计算时,df每列都会减去s。
shift函数是平移函数,s各个位置上的数向下平移,由于向下平移了两个位置,0和1位置上的数没有内容可以补,用nan自动替补。
Apply函数:
DataFrame.apply() 函数则会依次将每行或列取出来作为一个Series传递到apply指定的函数中。
1 | matrix = [ |
具体使用方法:
直方图与离散化:
1 | s = pd.Series(np.random.randint(0,7,size=10)) |
字符串方法:
1 | s = pd.Series(['A', 'B', 'C', 'Aaba', 'Baca', np.nan, 'CABA', 'dog', 'cat']) |
2.6 合并
结合:
contact()将零散的df合并,合并原则根据index和columns,相同合并,不同连接。
1 | df = pd.DataFrame(np.random.randn(10, 4)) |
连接:
join()直接将连个df连接起来。
1 | In [79]: left |
1 | In [84]: left |
追加:
append()为df追加行
1 | df.append(s,ignore_index=True) |
2.7 分组
按照某个column或columns,将df分组,然后结合df的函数分别计算各个分组。
1 | In [92]: df |
2.8 重塑

博客内容遵循 署名-非商业性使用-相同方式共享 4.0 国际 (CC BY-NC-SA 4.0) 协议
本文永久链接是:https://blog.sci.ci/2020/10/14/Pandas%E7%9F%A5%E8%AF%86%E6%80%BB%E7%BB%93/